Independent TESS transit searches
Transit candidates from multi-sector TESS searches
We search NASA TESS light curves for small transiting planets, combining every sector observed for each star, so that a transit too shallow to detect in one sector can be detected in all of them together. The full-sky search covered … FGKM dwarfs brighter than T = 13.5; earlier searches covered nearby K and M dwarfs, fainter M dwarfs and the hosts of TESS Objects of Interest. … signals pass automated and pixel-level vetting and are counted as candidates. Most are weak in any one sector and are on stars observed only in full-frame images, which SPOC's multi-sector searches do not cover. They are candidates, not confirmed planets: ground-based photometry, high-resolution imaging or radial velocities are needed to confirm or reject each one.
Simulated white noise with the depth (… ppm) and duration (… h) of the TOI-4342 candidate, scaled so that one sector gives SNR 3; twelve sectors then give about SNR 10. SPOC's single-sector detection threshold is 7.1. Real light curves also contain correlated noise.
What a transit looks like
When a planet crosses the face of its star it blocks a fraction of the light close to the ratio of the two discs' areas, so the depth of the dip is about (Rp/R*)². The star is brighter at its centre than at its edge (limb darkening), which rounds the bottom of the dip. A real candidate, drawn to scale:
Period, radius, duration and depth from ephemerides.csv; impact parameter from tiers_earlier_candidates.csv. The light curve is drawn on the same horizontal scale as the planet's path, so the dip starts and ends where the planet's disc meets the edge of the star (dotted lines). The planet crosses below the star's centre (impact parameter b), so its path across the disc, and the dip, are shorter than the star's diameter. Limb darkening is illustrative (quadratic, u₁ = 0.5, u₂ = 0.2).
The search, stage by stage
The full-sky search covered every FGKM dwarf with T ≤ 13.5 that the earlier searches had not, combining all of its TESS sectors (1–104). Almost every signal it finds is noise, a known planet or an eclipsing binary, and each stage below removes most of what is left. The bars count the first pass at SNR ≥ 9; the counted rows include both passes and the SNR 7.5–9 band.
A second pass searched again the … stars (…) that had QLP light curves the first pass missed, with the same checks: … signals at SNR ≥ 9 and … at SNR 7.5–9 passed the pre-filters, and … new ones passed every LEO-Vetter test. Bar lengths use a log scale. Stage counts are written by pipeline/funnel.py from the search's output tables (funnel_allsky.csv); counted rows are computed from the two candidate tables.
Where the host stars are
Every counted candidate at its host star's position, in a Hammer equal-area projection of the sky (right ascension increasing to the left). Hover over or tap a star for its numbers; select it to open it in the explorer.
Positions from ephemerides.csv. The stars in the background of every page are the same host stars.
Radius and orbital period
Orbital period against fitted radius for every counted candidate. Two regions of this plane have few known planets: the Neptunian desert, where few Neptune-sized planets are found close to their stars, and the radius valley between rocky super-Earths and sub-Neptunes with gas envelopes. Both are drawn as approximate regions.
Desert core: P < 3.2 d and 4–10 R⊕ (Castro-González et al. 2024), the definition of the catalogue's desert_flag. Radius valley: log₁₀R = −0.09 log₁₀P + 0.37 ± 0.045 (Van Eylen et al. 2018), measured for Sun-like stars; it is shown for orientation and not used by the pipeline. Radii use TIC 8.2 stellar radii.
The data are not new
For each full-sky candidate in tiers A, B and N we combined only the transits observed by the end of a given sector, to see when it could first have been found. Many reached SNR 9 years ago. They were missed because they are weak in any one sector, and because most are on stars observed only in full-frame images, which SPOC's multi-sector searches do not cover.
From findability.csv (notes). Each SNR is the inverse-variance mean depth of the transits observed by then, over its error; this ignores how fewer sectors would change the detrending and the period search.
The checks a candidate passes
Most transit-like signals in full-frame images are not planets around the target: they are noise, systematics, or eclipsing binaries whose light is blended with the target's. These are the checks a counted candidate has passed, in order. Stage counts are for the first pass at SNR ≥ 9 unless stated.
Known signals and the literature
all searches… matched a known planet, TOI, CTOI or SPOC detection; … were in the literature; … matched a nearby star's known signalBy period, including simple harmonics, and by transit epoch for community TOIs listed with a single transit or another period (… catalogue signals). The literature check covers candidate catalogues, arXiv papers, NASA ADS full text and Zenodo. ctoi_matches.md
LEO-Vetter
all searches… of … pre-filtered signals are new and pass every testThe 13 false-alarm and 4 false-positive tests of LEO-Vetter (Kunimoto et al. 2025), run after detrending again with the transits masked. Method, step 7
Signal strength and depth consistency
all searches… also have MES ≥ 7.1, a depth that agrees between sectors (χ²/dof ≤ 5) and Rp ≤ 20 R⊕A planet on the target gives the same depth in every sector. Full-sky search
Difference-image centroids and nearby stars
all searches… have a centroid offset over 15″; … only a TIC star within 15″ that could produce the dip; … no usable difference image; … none of theseSignals whose only flag is a nearby star go on to TRICERATOPS and a centroid likelihood ratio, and can enter tier N (MES ≥ 10). Tier N
Binary stars
all searches… full-sky signals are likely binaries, … of them from Gaia radial velocities; … grazing and … high-RUWE signals are in tier CGaia DR3 (RUWE, eclipsing binaries, non-single-star orbits, epoch radial velocities), the TESS eclipsing-binary catalogue (Prša et al. 2022), APOGEE binaries (Kounkel et al. 2021) and VSX. Tier C is not counted. gaia_proper_motion.md
TRICERATOPS with Gaia limits
every candidatemedian FPP of the counted candidates … → … with Gaia limits; … smaller than 8 R⊕ meet FPP < 0.015 and NFPP < 0.001Every counted candidate has FPP < 0.5 and NFPP < 0.1 after the centroid ratio. MOLUSC removes bound companions that Gaia would have resolved, and Gaia epoch radial velocities rule out an eclipsing binary on bright targets. Statistical validation would also need high-resolution imaging. gaia_companion_limits.md
Centroids in every sector
every candidate… signals removed (an offset away from the target in every sector, p < 0.001); … counted candidates flagged (p < 0.01)The difference-image centroid is measured in every sector with transits and tested for a consistent offset from the target and towards each nearby star bright enough to cause the dip. centroid_sectors.md
False-alarm classifier
SNR 7.5–9selects … of … clean SNR 7.5–9 signals, with about … expected false alarms; … also pass the other checks (tier L1)A gradient-boosted classifier trained to tell the search's signals from those found in inverted light curves, where every dip is noise. Its validation keeps all signals of a star together. false_alarm_classifier.md
Counts are computed from funnel_allsky.csv, the candidate tables and the classifier scores in the repository.
TOI-4342: a possible third transiting planet
- TOI-4342 b and c are confirmed sub-Neptunes at 5.54 and 10.69 d (Tey et al. 2023; masses from ESPRESSO, 2026, which also reports a probably non-transiting 47.5 d radial-velocity candidate).
- The candidate transits every … d; its fitted radius is … R⊕, similar to those of b and c.
- The search of TOI hosts, which masks b and c first, finds it as the strongest remaining signal. TRICERATOPS with Gaia limits gives FPP ….
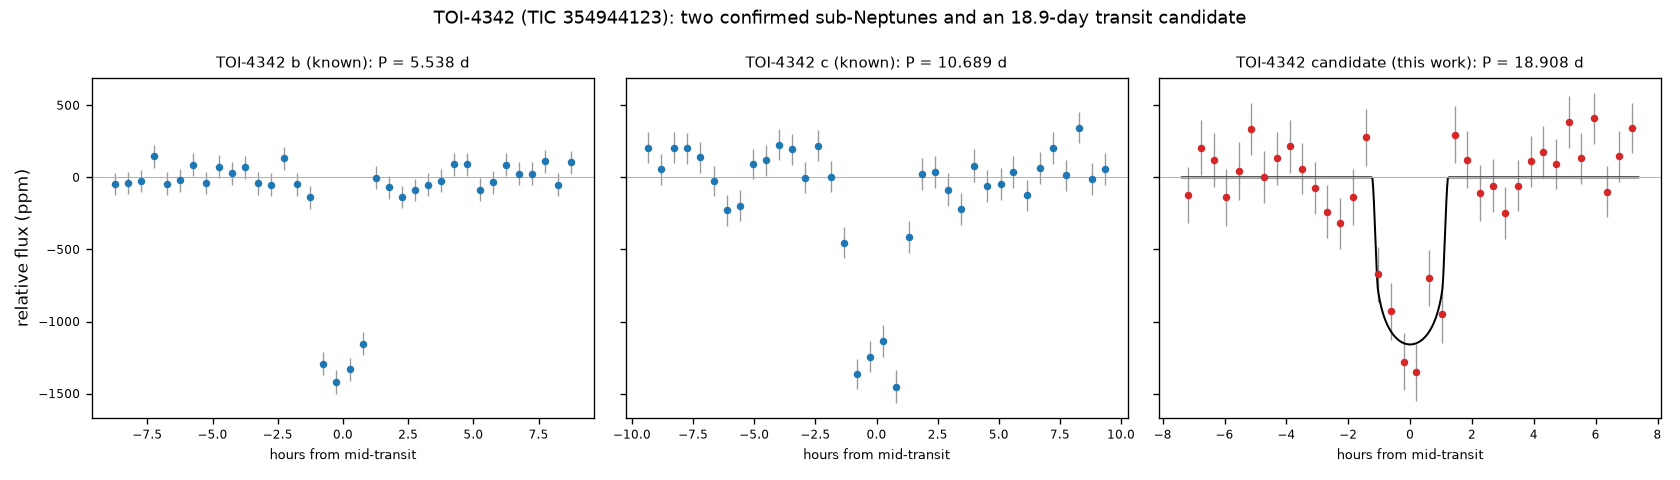
Figure from the repository (figures/toi4342.png).

Predicted transit times
Every registered candidate has predicted mid-transit times, committed to the repository before the transits happen: for a planet, each transit should appear at the predicted time with the fitted depth. The next 48 hours, and the next ten transits:
- …Loading predictions
Times are UTC at Earth's centre from predictions.csv, assuming a constant period; ± is the 1σ uncertainty. Local times use this device's time zone. Whether a transit is observable depends on your site and the star's position.
Limits, and how to help
Some are false alarms
From the search of inverted light curves, in which every dip is noise, we expect about … false alarms among the … full-sky candidates in tiers A and B, about … among the … in tier N and about … among the … in tier L1.
Companions closer than 1–2″
The pixel checks cannot see a companion star closer than about 1–2″, which could be the source of the dip. Only high-resolution imaging can rule it out.
Confirm or reject each candidate
TESS alone cannot rule out every false-positive scenario. Ground-based photometry at the predicted times, high-resolution imaging and radial velocities are needed.
Updates
From the dated release notes in the README; the current total is computed from the tables.